Note
Go to the end to download the full example code or to run this example in your browser via Binder.
Plotting PUNCH data#
How to plot PUNCH data using built-in plotting tools
So you’ve downloaded a PUNCH FITS file, and you want to display it in Python in a simple way. We’ve encapsulated a flexible plotting function within the punchbowl repository that users can use and build on.
First we’ll load a set of libraries. This is minimal, but will provide a sample file to use for plotting, and the plotting function itself.
from punchbowl.data.sample import PUNCH_CAM
from punchbowl.data.visualize import plot_punch
Files Downloaded:   0%|          | 0/1 [00:00<?, ?file/s]

PUNCH_L3_CAM_20251022223629_v0h.fits:   0%|          | 0.00/18.2M [00:00<?, ?B/s]

PUNCH_L3_CAM_20251022223629_v0h.fits:   1%|          | 128k/18.2M [00:00<00:16, 1.10MB/s]

PUNCH_L3_CAM_20251022223629_v0h.fits:  14%|█▍        | 2.57M/18.2M [00:00<00:01, 13.9MB/s]

PUNCH_L3_CAM_20251022223629_v0h.fits:  63%|██████▎   | 11.5M/18.2M [00:00<00:00, 46.9MB/s]

PUNCH_L3_CAM_20251022223629_v0h.fits:  89%|████████▉ | 16.3M/18.2M [00:00<00:00, 39.0MB/s]


Files Downloaded: 100%|██████████| 1/1 [00:00<00:00,  1.40file/s]
Files Downloaded: 100%|██████████| 1/1 [00:00<00:00,  1.40file/s]
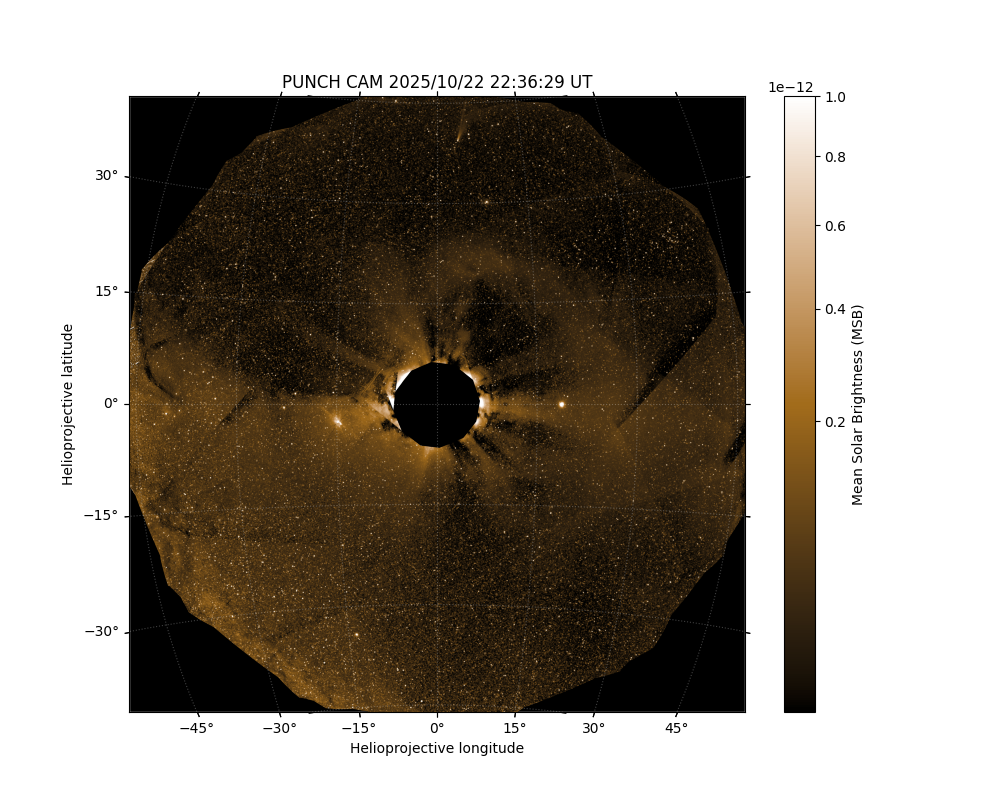
Next we’ll plot the data. Note that you can provide as input either a path to a FITS file directly, or alternatively a loaded NDCube object.
plt, ax = plot_punch(PUNCH_CAM)
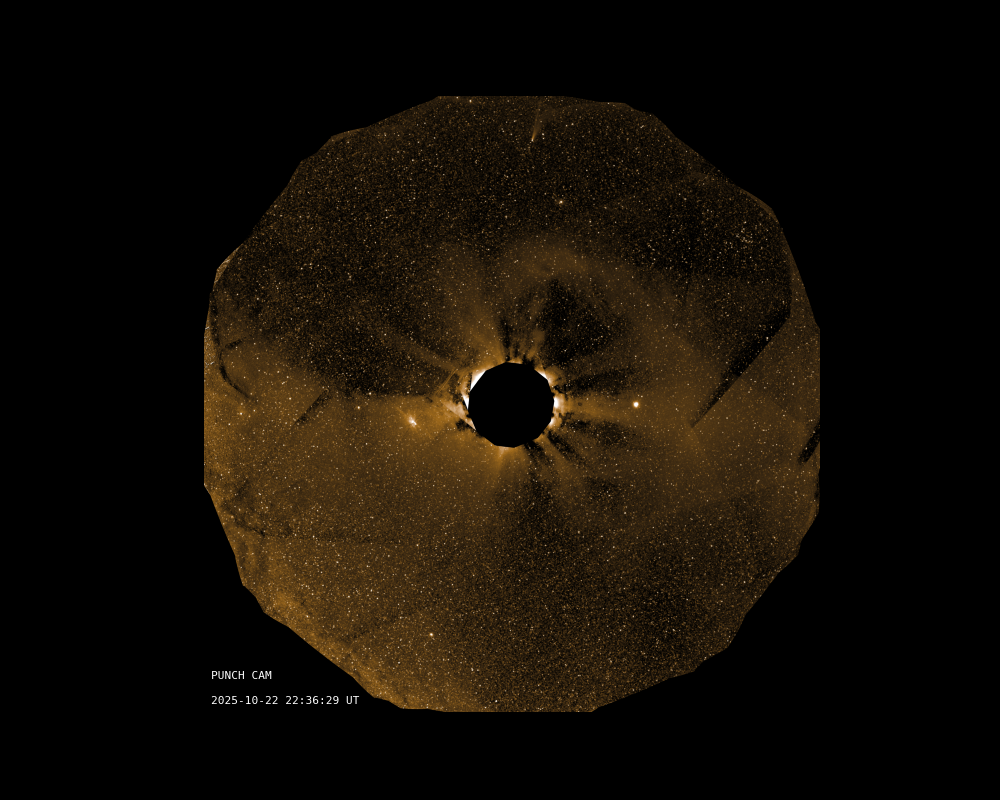
This is using the default parameters, but the function is flexible to plot in a few different ways. For example, let’s say we want a minimal plot of just the data, but still with some annotation.
plt, ax = plot_punch(PUNCH_CAM, axes_off=True)
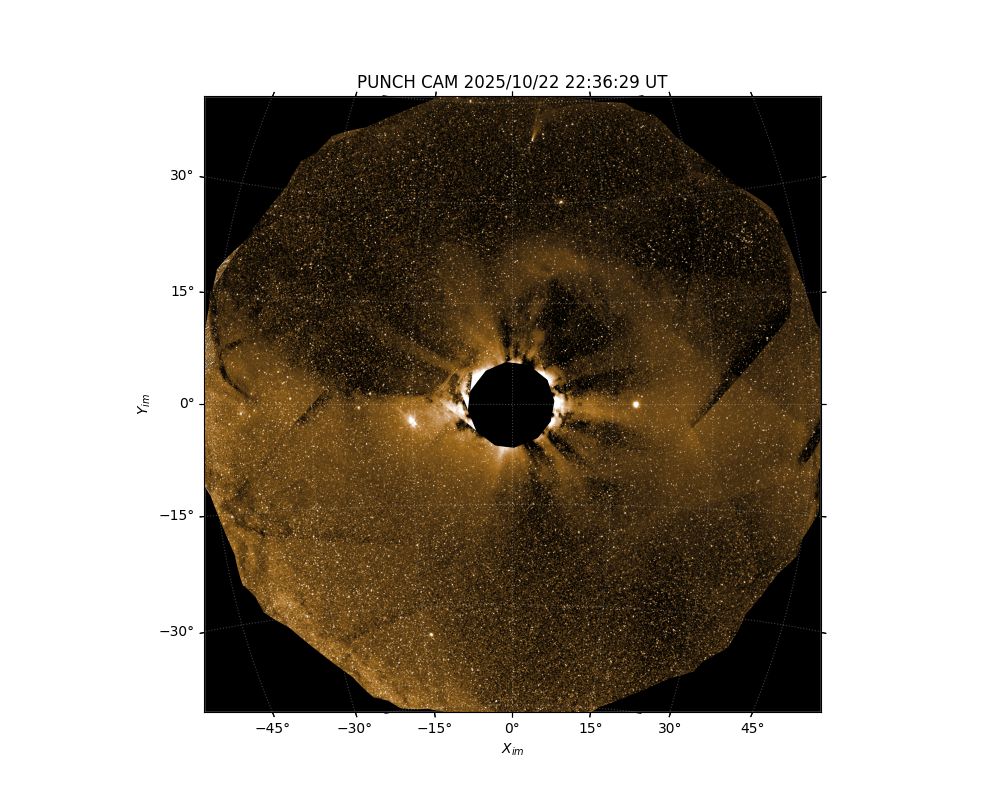
For a more complex example let’s bring down the vmax value a bit, relabel the axes, and turn off the colorbar.
plt, ax = plot_punch(PUNCH_CAM, vmax=5e-13, axes_labels=(r'$X_{im}$', r'$Y_{im}$'), colorbar=False)
A variety of other plotting elements and options can be controlled - for full details see the function docstring or ask the SOC.
Total running time of the script: (0 minutes 8.491 seconds)