Note
Go to the end to download the full example code or to run this example in your browser via Binder.
Creating PUNCH RGB maps#
This example creates RGB maps using PUNCH MZP triplets. MZP images are mapped to RGB channel based on formalism presented in DeForest et al. (2022) and Patel et al. (2023).
import warnings

warnings.filterwarnings("ignore", category=RuntimeWarning)

import matplotlib.pyplot as plt
import numpy as np

from punchbowl.data.punch_io import load_ndcube_from_fits
from punchbowl.data.sample import PUNCH_PIM
from punchbowl.data.visualize import generate_mzp_to_rgb_map
Files Downloaded:   0%|          | 0/1 [00:00<?, ?file/s]

PUNCH_L3_PIM_20251101093829_v0h.fits:   0%|          | 0.00/25.9M [00:00<?, ?B/s]

PUNCH_L3_PIM_20251101093829_v0h.fits:   0%|          | 113k/25.9M [00:00<00:23, 1.11MB/s]

PUNCH_L3_PIM_20251101093829_v0h.fits:   7%|▋         | 1.74M/25.9M [00:00<00:02, 9.89MB/s]

PUNCH_L3_PIM_20251101093829_v0h.fits:  29%|██▉       | 7.61M/25.9M [00:00<00:00, 31.9MB/s]

PUNCH_L3_PIM_20251101093829_v0h.fits:  43%|████▎     | 11.0M/25.9M [00:00<00:00, 32.9MB/s]

PUNCH_L3_PIM_20251101093829_v0h.fits:  56%|█████▋    | 14.6M/25.9M [00:00<00:00, 33.7MB/s]

PUNCH_L3_PIM_20251101093829_v0h.fits:  70%|██████▉   | 18.0M/25.9M [00:00<00:00, 33.9MB/s]

PUNCH_L3_PIM_20251101093829_v0h.fits:  83%|████████▎ | 21.5M/25.9M [00:00<00:00, 34.3MB/s]

PUNCH_L3_PIM_20251101093829_v0h.fits:  96%|█████████▋| 24.9M/25.9M [00:00<00:00, 34.3MB/s]


Files Downloaded: 100%|██████████| 1/1 [00:00<00:00,  1.08file/s]
Files Downloaded: 100%|██████████| 1/1 [00:00<00:00,  1.07file/s]
We’ll being by loading data from a sample PIM data product into an ndcube object. Note that other polarized data could be substituted in place - see the example notebook on querying data using Fido.
punch_cube = load_ndcube_from_fits(PUNCH_PIM)
Check if the data contains any infs and mask them out.
parr = np.zeros((3,4096,4096))
mask = np.isfinite(punch_cube.data)
parr[mask] = punch_cube.data[mask]
Use the punchbowl function to map PUNCH polarizer triplets to RGB colorspace. Parameters can be tuned to enhance the visual appearance as required.
rgb_sat, rgb_raw = generate_mzp_to_rgb_map(punch_cube.data,
                                        gamma=1/2.2,
                                        frac=.1,
                                        s_boost=1.25)
Display the result image.
fig = plt.figure(figsize=(10, 8))
ax = fig.add_subplot(111, projection=punch_cube.wcs.slice(2,2))
ax.imshow(rgb_sat, origin='lower')
ax.set_axis_off()
ax.text(0.005,0.005,f"{punch_cube.meta.datetime.strftime('%Y/%m/%d %H:%M:%S' + 'UT')}",
        horizontalalignment='left', transform=ax.transAxes,
        fontsize=12, color='white')
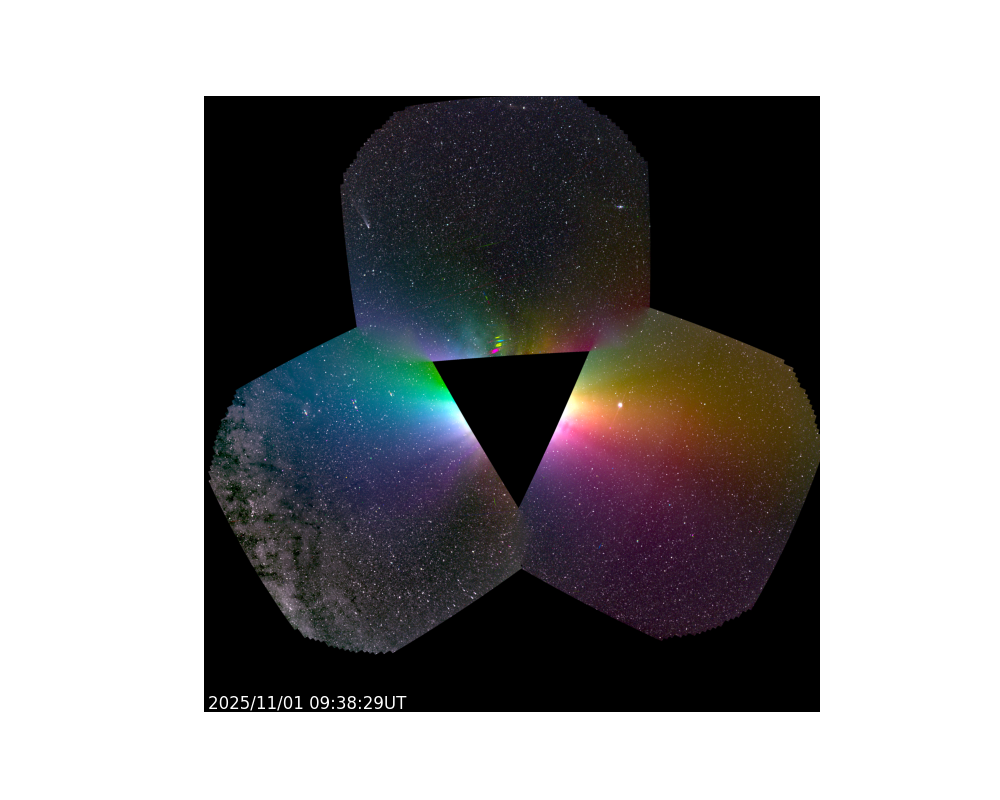
Text(0.005, 0.005, '2025/11/01 09:38:29UT')
Total running time of the script: (0 minutes 5.343 seconds)