Note
Go to the end to download the full example code or to run this example in your browser via Binder.
Overplotting Parker Solar Probe and Solar Orbiter Trajectories on PUNCH Images#
This notebook demonstrates how to overplot spacecraft trajectories on a sample PUNCH image.
First, we project the spacecraft positions onto the images directly.
Second, we show how to plot in 3D the trajectories and the images assuming the pixel intensity can be associated with the Thomson sphere
Import Required Libraries
import datetime

import astropy.units as u
import matplotlib.pyplot as plt
import numpy as np
import sunpy.coordinates
import sunpy.map
from sunpy.net import Fido
from sunpy.net import attrs as a

import punchbowl.data.sample as samples
Load Sample PUNCH Map#
pam_file = samples.PUNCH_PAM
pam_map = sunpy.map.Map(pam_file)[0]
Files Downloaded:   0%|          | 0/1 [00:00<?, ?file/s]

PUNCH_L3_PAM_20240620000000.fits:   0%|          | 0.00/39.6M [00:00<?, ?B/s]

PUNCH_L3_PAM_20240620000000.fits:   0%|          | 128k/39.6M [00:00<00:35, 1.10MB/s]

PUNCH_L3_PAM_20240620000000.fits:   9%|▉         | 3.57M/39.6M [00:00<00:01, 19.2MB/s]

PUNCH_L3_PAM_20240620000000.fits:  27%|██▋       | 10.9M/39.6M [00:00<00:00, 42.7MB/s]

PUNCH_L3_PAM_20240620000000.fits:  39%|███▊      | 15.3M/39.6M [00:00<00:00, 42.4MB/s]

PUNCH_L3_PAM_20240620000000.fits:  50%|████▉     | 19.6M/39.6M [00:00<00:00, 40.8MB/s]

PUNCH_L3_PAM_20240620000000.fits:  60%|██████    | 23.8M/39.6M [00:00<00:00, 37.7MB/s]

PUNCH_L3_PAM_20240620000000.fits:  70%|██████▉   | 27.6M/39.6M [00:00<00:00, 36.6MB/s]

PUNCH_L3_PAM_20240620000000.fits:  79%|███████▉  | 31.3M/39.6M [00:00<00:00, 35.1MB/s]

PUNCH_L3_PAM_20240620000000.fits:  88%|████████▊ | 34.9M/39.6M [00:00<00:00, 35.2MB/s]

PUNCH_L3_PAM_20240620000000.fits:  97%|█████████▋| 38.4M/39.6M [00:01<00:00, 35.3MB/s]


Files Downloaded: 100%|██████████| 1/1 [00:01<00:00,  1.22s/file]
Files Downloaded: 100%|██████████| 1/1 [00:01<00:00,  1.22s/file]
/home/docs/checkouts/readthedocs.org/user_builds/punchbowl/envs/0.0.21/lib/python3.12/site-packages/sunpy/map/mapbase.py:249: SunpyUserWarning: This file contains more than 2 dimensions. Data will be truncated to the first two dimensions.
  warn_user("This file contains more than 2 dimensions. "
Generate Spacecraft Trajectories#
Uses sunpy.coordinates.get_horizons_coord
map_time = pam_map.observer_coordinate.obstime.to_datetime()

time_start = map_time - datetime.timedelta(days=15)
time_end = map_time + datetime.timedelta(days=15)

parker_stonyhurst = sunpy.coordinates.get_horizons_coord('Parker Solar Probe',
                   time={'start': time_start,
                          'stop': time_end,
                          'step': int((time_end-time_start).total_seconds()/3600/6) # Timestep every 6 hours
                        })
solo_stonyhurst = sunpy.coordinates.get_horizons_coord('Solar Orbiter',
                   time={'start': time_start,
                          'stop': time_end,
                          'step': int((time_end-time_start).total_seconds()/3600/6)
                        })
earth_stonyhurst = sunpy.coordinates.get_horizons_coord(399,
                   time={'start': time_start,
                          'stop': time_end,
                          'step': int((time_end-time_start).total_seconds()/3600/6)
                        })
INFO: Obtained JPL HORIZONS location for Parker Solar Probe (spacecraft) (-96) [sunpy.coordinates.ephemeris]
INFO: Obtained JPL HORIZONS location for Solar Orbiter (spacecraft) (-144) [sunpy.coordinates.ephemeris]
INFO: Obtained JPL HORIZONS location for Earth (399)                     [sunpy.coordinates.ephemeris]
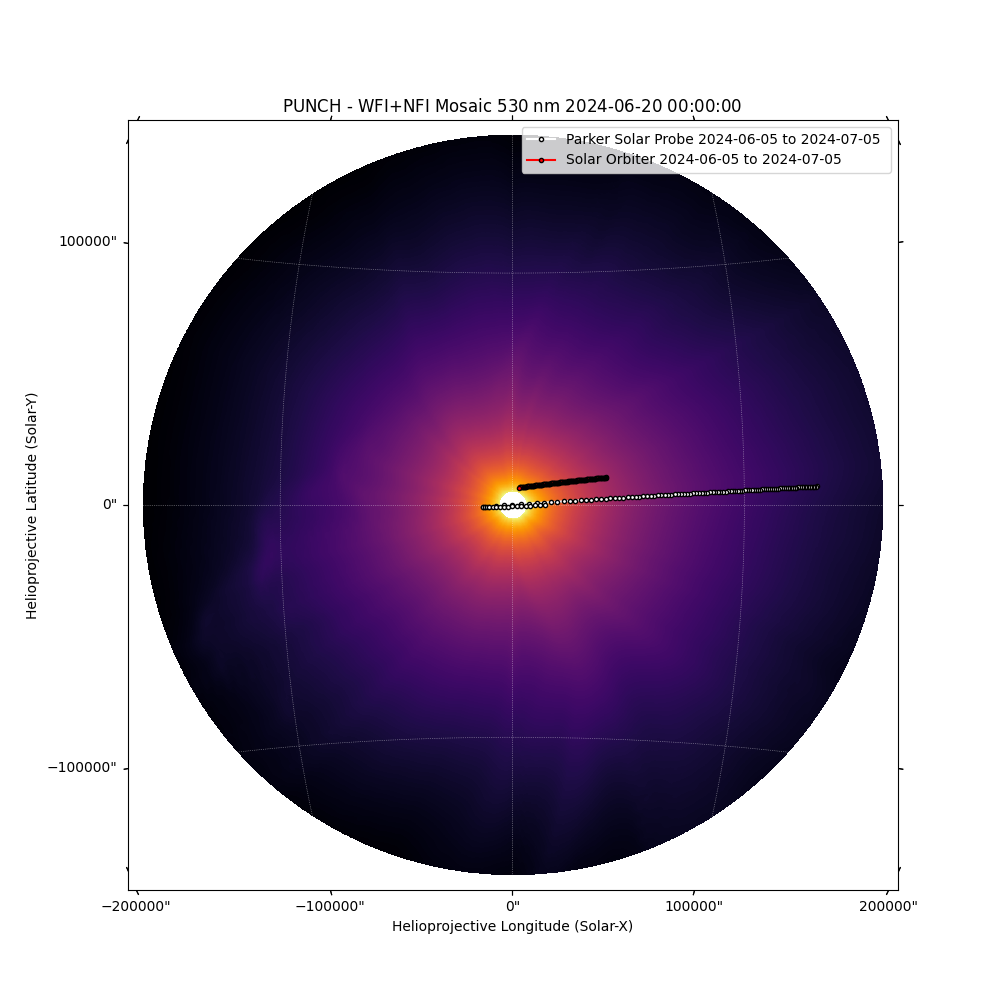
Overplot Trajectories on PUNCH Field of View#
Distance from plane of sky is deprojected
fig = plt.figure(figsize=(10,10))
ax = fig.add_subplot(projection=pam_map.wcs)
pam_map.plot(axes=ax,norm='log',cmap='inferno')

ax.plot_coord(parker_stonyhurst,marker="o",ms=3,mec='black',color="white",label=f"Parker Solar Probe {time_start.date()} to {time_end.date()} ")
ax.plot_coord(solo_stonyhurst,marker="o",ms=3,mec='black',color="red",label=f"Solar Orbiter {time_start.date()} to {time_end.date()} ")

ax.legend()

plt.show()
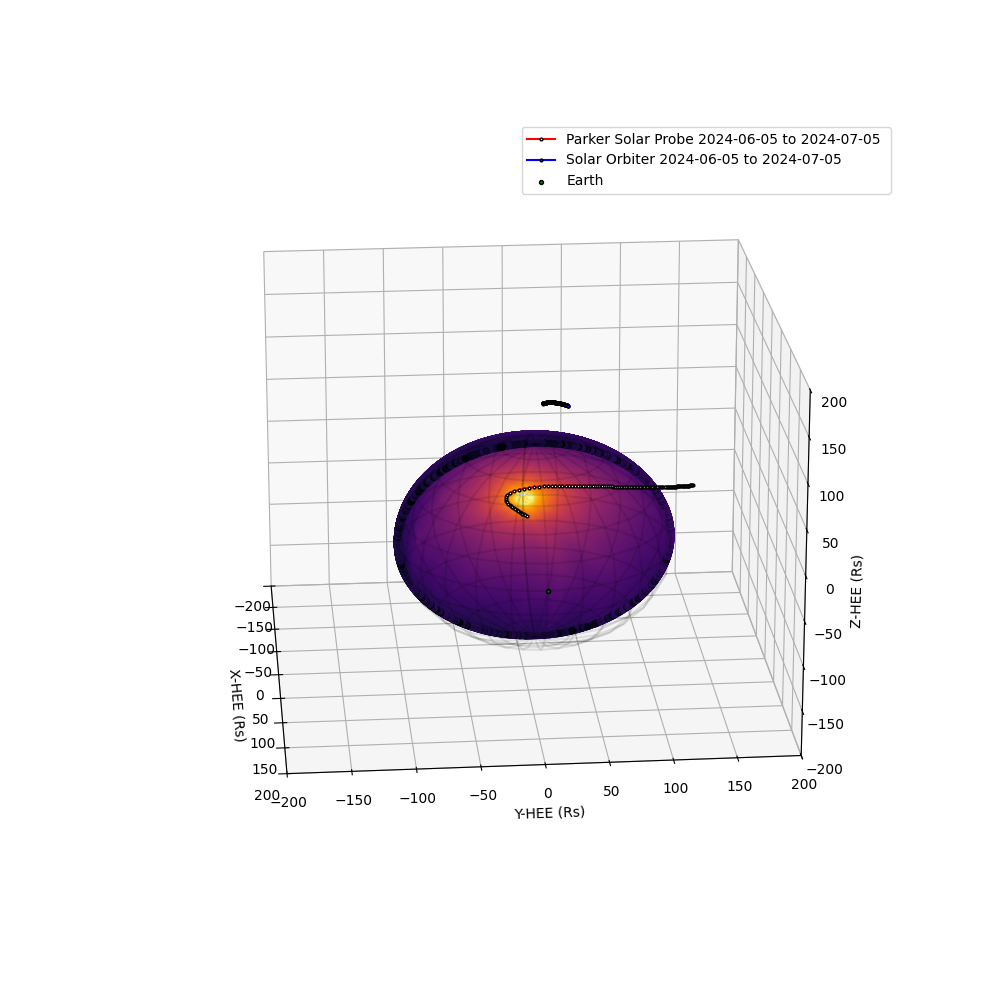
Plot Isometrically Assuming PUNCH Data is on the Thomson Sphere#
First, produce the 3D pixel values
### Downsample for feasible 3D plotting time/computation
pam_map_lowres = pam_map.resample([512,512]*u.pix)

### Get 3D Plane of Sky Cartesian Pixel Coordinates
coords=sunpy.map.all_coordinates_from_map(pam_map_lowres)
coords.representation_type='cartesian'

### Project to Thomson Sphere
rall =np.linalg.norm([coords.x,coords.y,coords.z],axis=0)
rhoall = np.linalg.norm([coords.y,coords.z],axis=0)
cosalpha = np.sqrt(1 - (rhoall/rall)**2)

xthomp = coords.x*u.au.to("R_sun")*cosalpha
ythomp = coords.y*u.au.to("R_sun")*cosalpha
zthomp = coords.z*u.au.to("R_sun")*cosalpha
Do plot#
fig = plt.figure(figsize=(10,10))
ax = fig.add_subplot(projection='3d')

# Plot the PUNCH data
ax.scatter(215-xthomp,ythomp,zthomp,c=np.log10(pam_map_lowres.data), cmap="inferno",alpha=0.9)

# Plot a wireframe grid showing the full thomson sphere
uu, vv = np.meshgrid(np.linspace(0,360,25),np.linspace(-90,90,13))*u.deg
x = 215/2* (1 + np.cos(uu)*np.cos(vv))
y = 215/2* np.sin(uu)*np.cos(vv)
z = 215/2*np.sin(vv)
ax.plot_wireframe(215-x, y, z, color="black",alpha=0.1)

# Plot Parker Solar Probe
parker_stonyhurst.representation_type="cartesian"
ax.plot(parker_stonyhurst.x.to("R_sun"),
        parker_stonyhurst.y.to("R_sun"),
        parker_stonyhurst.z.to("R_sun"),
        marker="o",ms=2,mec='black',mfc="white",color="red",label=f"Parker Solar Probe {time_start.date()} to {time_end.date()} ",
        zorder=10
       )

# Plot Solar Orbiter
solo_stonyhurst.representation_type="cartesian"
ax.plot(solo_stonyhurst.x.to("R_sun"),
        solo_stonyhurst.y.to("R_sun"),
        solo_stonyhurst.z.to("R_sun"),
        marker="o",ms=2,mec='black',mfc="blue",color="blue",label=f"Solar Orbiter {time_start.date()} to {time_end.date()} ",
        zorder=10
       )

# Plot Earth
ax.scatter(215,0,0,marker="o",color="green",ec="black",s=8,label="Earth")

# Point Camera
ax.view_init(20,-5)

# Control Aspect Ratio
zoom = 200
ax.set_xlim(-zoom,zoom)
ax.set_ylim(-zoom,zoom)
ax.set_zlim(-zoom,zoom)

ax.legend()

ax.set_xlabel("X-HEE (Rs)")
ax.set_ylabel("Y-HEE (Rs)")
ax.set_zlabel("Z-HEE (Rs)")

plt.show()
Total running time of the script: (0 minutes 20.844 seconds)